Food Safety Risk Explanation
How YOU and YOUR children may benefit:
- Understanding the DyeDiet Food Safety Risk concept gives you a gauge which helps you to indentify and avoid chemical hazards in your and your child’s diet.
- When you feel that you can rely on the DyeDiet analysis you may choose not to try solving the puzzles of ingredients lists. The DyeDiet will analyze and translate it all for you!
Basic definitions
I keep receiving questions with regard to Food Safety Risk Score (DDRS) comparison. This encouraged me to write the present explanation of the principles in a FAQ format:
- What DDRS is? Answer: The DyeDiet Risk Score is a sum of individual Risk Factors (DDRF) assigned to every additive:
DDRS = DDRF1 + DDRF2 + DDRF3 +… DDRFn
- What are “good” or “bad” DDRS values? Answer: There are no “good” or “bad” numbers. Absolute DDRS values taken out of the context do not mean too much. What do matter are relative DDRS values when closely related products are compared. Apples to apples, oranges to oranges. Amount of the red color on a diagram associated with a DDRS value is important. More red segments means more health risks come with foreign chemicals and that is “bad.”
- What about risks which come from nutrients? Answer: Those risks are OK. Nutritional risk factors naturally and inevitably come with even perfectly nutritious food. The only thing you need practicing in response is moderation.
In other words, higher numbers and “red diagrams” is what you look to avoid whereas “green diagram” means it is a nutritional product you may want to buy, no matter how high the DDRS numbers are.
Let us consider the illustrative examples below.
Same food category
Assume we want to compare Product A and Product B that are closely related as to the similar sets of ingredients. They belong to the same food category.
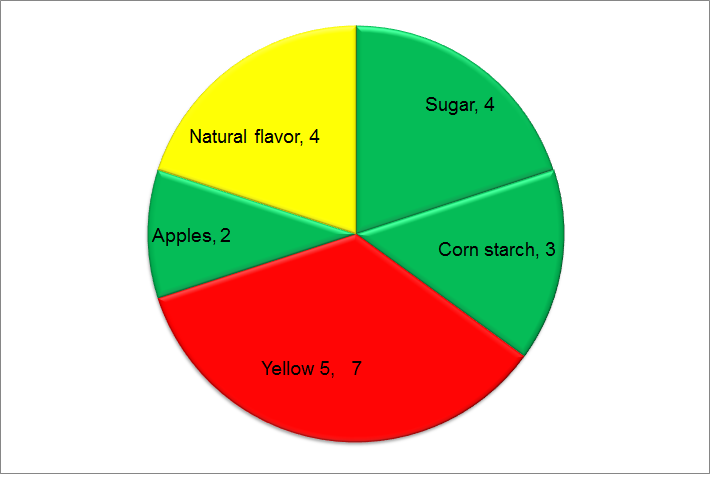
Product A Diagram, DDRS = 20
Overall health risk comes with 1 benign (yellow), 1 FOREIGN (red) and 3 nutritional (green) additives; DDRS = 4 + 7 + 2 + 4 + 3 = 20.
Product B Diagram, DDRS = 30
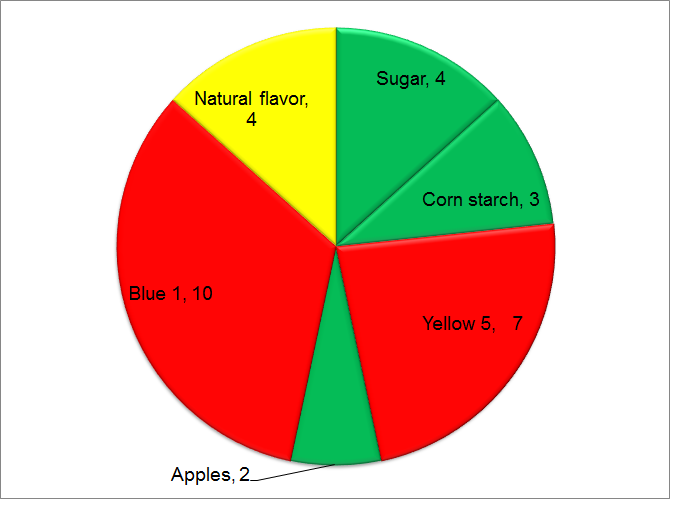 Overall health risk comes with 1 benign (yellow), 2 FOREIGN (red) and 3 nutritional (green) additives; DDRS = 4 + 10 + 7 + 2 + 4 + 3 = 30 What we see from the comparison of the two diagrams is that higher DDRS value is associated with the larger red “territory” relative to the green nutritional one. The conclusion is obvious: Product A is less risky to consume because both the DDRS value (30 > 20) and the amount of red color (B > A) are higher in the diagram B.
So, when two closely related food products are compared, the lower DDRS value the safer is the product.
The above may not be the case for completely different products with different sets of the additives and ingredients.
Different food categories
Let us consider products C and D that belong to different food categories.
Product C Diagram, DDRS = 20
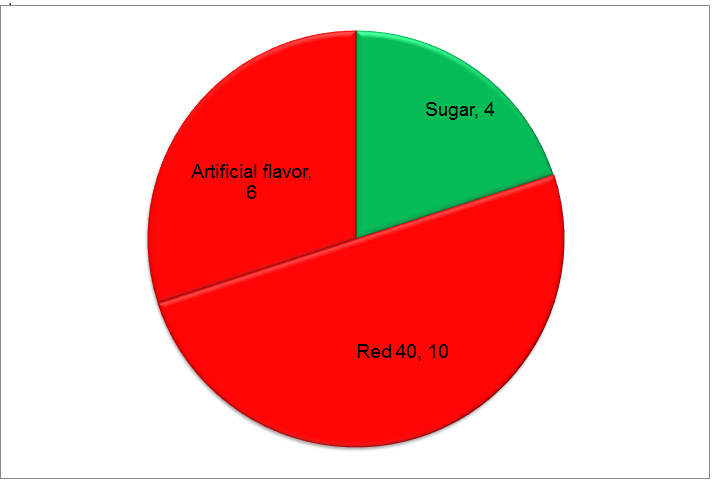 DDRS = 10 + 6 + 4 = 20 where 16 units of health risk come from FOREIGN (red segments) and only 4 from NUTRITIONAL (green segment) additives. The product is “bad” in accord with the above definitions.
Product D Diagram, DDRS = 30
Imaginary Product D consists of 12 nutritional ingredients DDRF 2 each (green segments) and 2 benign additives of DDRF 3 each (yellow segments):
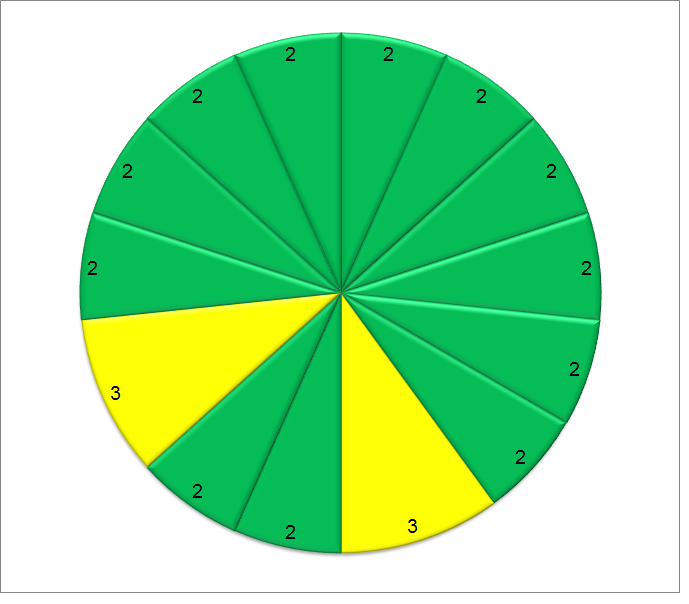 Correspondingly, it’s DDRS = (2 x 12) + (2 x 3) = 30 which is 10 units higher than DDRS of the Product C! What does this mean? Answer: Product D is less risky to eat because its 30 DDRS units come mostly from the nutritional ingredients, green segments. We see the opposite on the product C diagram which is mostly red. This is the traffic lights association: go – no go.
- An equal or even higher DDRS value that comes from NUTRIENTS (green) and benign (yellow) additives means that the product may be harmful only if overly consumed and may not be harmful in moderation because all the ingredients can be of use in the human body.
- A DDRS coming mostly from FOREIGN additives (red) means that the product may be harmful even if consumed in moderation because foreign additives have no business in the human body.
For a direct comparison of any products from different food categories two new parameters may be helpful. Here they are.
The DyeDiet Foreign Additive Risk Impact (DDFI)
DDFI is simply a ratio of all foreign risk factors DDRFs (red segments) to all nutritional DDRFs (green segments):
 It does reflect the risks posed by all foreign food additives (like food dyes, artificial flavors, preservatives, etc.) relative to nutrients that are present in a product. For the most of foods we eat, DDFI will be within the range of 0 to 15 or 20. The higher is DDFI value the higher is overall health risk and the lower is nutrition value of the food product.
The DyeDiet Nutrition Factor (DDNF)
The DyeDiet Nutrition Factor (DDNF) is introduced to reflect nutritional value of a food product. It is a ratio of all Nutrition DDRFs (green segments) to a sum of all foreign (red) and benign (yellow segments) DDRFs:
 As you may see from the equation, more foreign and benign additives will bring the Nutrition Factor (DDNF) down. Because of generally higher values of foreign food additive risk factors (DDRF) their presence will reduce the overall nutrition value down faster than that of benign food additives.
Let us turn back to our examples.
Products A, B, C and D comparison chart
| Foreign DDRF | Benign
DDRF |
Nutritional DDRF |
DDRS | DDFI | DDNF | Recommen
dation |
|
| Product A | 7 | 4 | 9 | 20 | 0.8 | 0.8 | Not really |
| Product B | 17 | 4 | 9 | 30 | 1.9 | 0.4 | No |
| Product C | 16 | 0 | 4 | 20 | 4.0 | 0.25 | No |
| Product D | 0 | 6 | 24 | 30 | 0.0 | 4 | Yes |
Again, along with the prevalent color in the diagram DDFI and DDNF numbers clearly indicate:
- Product D is safest in the list with green diagram, lowest possible DDFI = 0 and highest nutrition factor (DDNF = 4);
- Product A is less risky of the three remaining but still is not recommend because it’s nutrition factor is less than 1 (food dye is present), and
- Product C is the most potentially dangerous of the four despite low DDRS value. It has high health risks coming from foreign food additives (DDFI = 4) and very low nutritional value (DDNF = 0.25). In reality, this one would be the worst example of some junk food.
I hope this helps.
Category: Food and Risk



Hey very good weblog!! Man .. Stunning .. Amazing .. I’ll bookmark your weblog and take the feeds also…Bryce Hudec
I highly appreciate your support!
Thanks for such the amazing blog! I found your post interesting and informative, i really learned a lot.
There are some fascinating time limits on this article however I don’t know if I see all of them heart to heart. There is some validity but I will take hold opinion until I look into it further. Good article , thanks and we wish more! Added to FeedBurner as effectively